The analytical quality controls, known as AQC, play an important part in assuring the quality of laboratory tests. Analytical Quality Control material are inserted into the testing process and treated as if they were samples by being exposed to the same testing conditions. The purpose of including analytical quality control is to evaluate the reliability and precision of a test method over time and under varying operating conditions (e.g. environment, staff, weather etc.). The AQC samples must be analysed at least once during each analytical run ( a sample batch with similar testing requirement and contents).
The analytical quality control materials should have the following characteristics;
- have the same/similar matrix as samples to be measured,
- simple to use because complicated reconstitution procedures increase the chance of errors,
- stable for long periods of time,
- available in large enough quantities,
- have target values that are close to samples,
The selection of AQC is highly dependent on test method to be controlling and AQC’s accessibility. These two factors determine the AQC development to be followed. The AQC can be developed in-house or by a reference method.
- The in-house AQC must be analysed to determine the target values and acceptable range. At least five determinations are carried out to determine the mean value and standard deviation of all determinations. It is always recommended the participation of at least two laboratories to evaluate the initial determinations and eliminate errors.
- The reference method is well known as Certified Reference Material, CRM , is measured by a reference method and sold with published target values. They are more expensive than in-house AQC controls and are not cost effective for routine quality control.
Once the AQC are established, the interpretation of quality control data involves both graphical and statistical methods. Quality control data is most easily visualized using a XY chart. The dates of analyses are plotted along the X-axis and control values are plotted on the Y-axis. The mean and standard deviation limits are also marked on the Y-axis. Inspecting the pattern of plotted points provides a simple way to detect increased random error and shifts or trends in calibration and/or factors used to correct calibration measurements.
With a correctly operating system, repeat testing of the same control sample should produce a Gaussian distribution. That is, approximately 95% of values should fall between the (+/-) two times standard deviation “2s” ranges and 99% between the (+/-) 3s limits. This means that 1 data point in in 100 will fall outside the 3s limits in a correctly operating system. In general, the (+/-) 2s limits are considered to be warning limits. The +/-3s limits are rejection limits. When a value falls outside of the 3s limits the analysis should stop, and the measurement should be investigated and repeated. Values falling between 2s and 3s indicates the analysis should be subjected to evaluation to achieve values within the 1s zone. If consecutive values lie between 2s and 3s zones the analysis must be investigated to identify potential systematic errors.
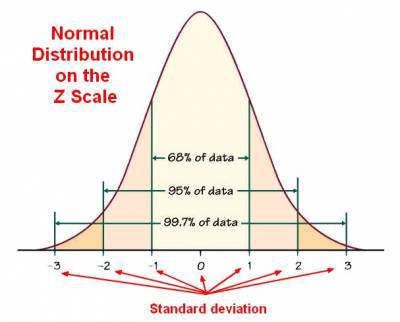
Chart 1. Shows a general description of Gaussian or normal distribution ( source https://datacadamia.com/data_mining/normal_distribution)
Reviewing the pattern of points plotted over time is useful in spotting shifts and trends in testing method. A trend is a continuous movement of values in one direction over six or more analytical runs. Trends can start on one side of the mean and move across it or can occur entirely on one side of the mean. The occurrence of shifts and trends on AQC chart is the result of either proportional or constant error knows as bias errors.
Some of the most common problems causing AQC samples to shift are:
- AQC sample deterioration due to contamination or due to ageing
- Equipment malfunction
- Calibration of glass-were
- Human systematic errors
When these problems are identified the corrective actions should be taken and recorded. It is important to record every quality control value, including those that are out of control. If quality control samples are routinely rerun until they fall within the current control limits and the outliers are not recorded, the acceptable range will become smaller each time they are recalculated. Eventually they will approach zero standard deviation and become useless and unattainable. AQC should be reviewed approximately every six months and new mean and standard deviation calculated.
In conclusion, to produce accurate and precise measurement results, the analytical quality control samples plays as important key role as calibration of the equipment and calibration verification.
Analytical Services use AQC charts for all Analytical Test Methods (ATM) as a quality requirements to comply with ISO 17025:2017. For example, for the ATM 106, Chart 1 shows the recovery data of silver. The ATM 106 includes the determination of silver in medical device (dressing, paste powders etc.).
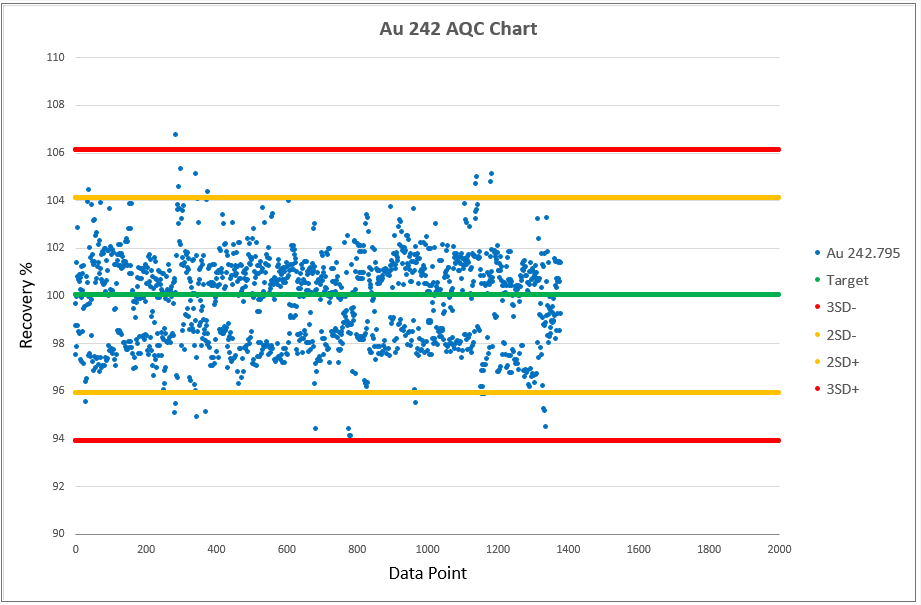
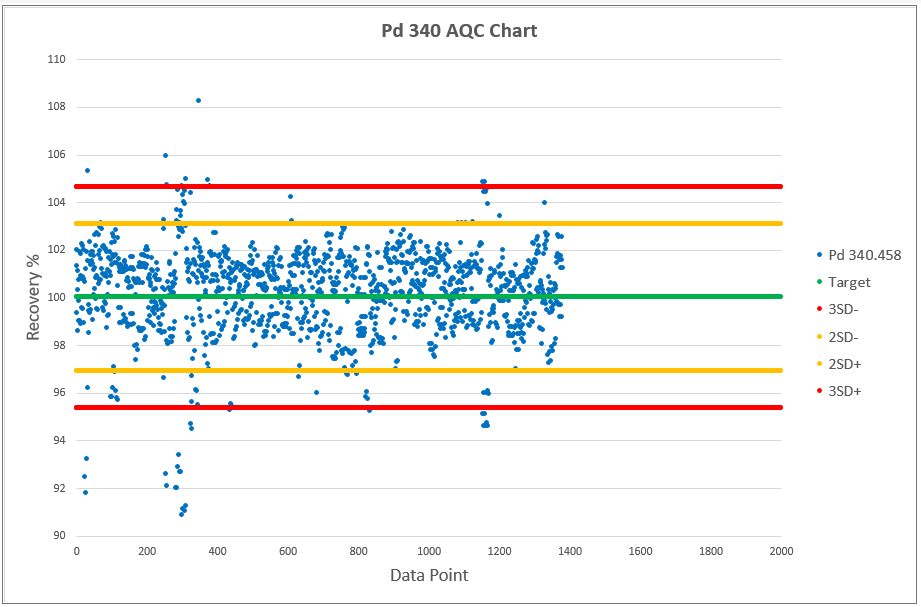
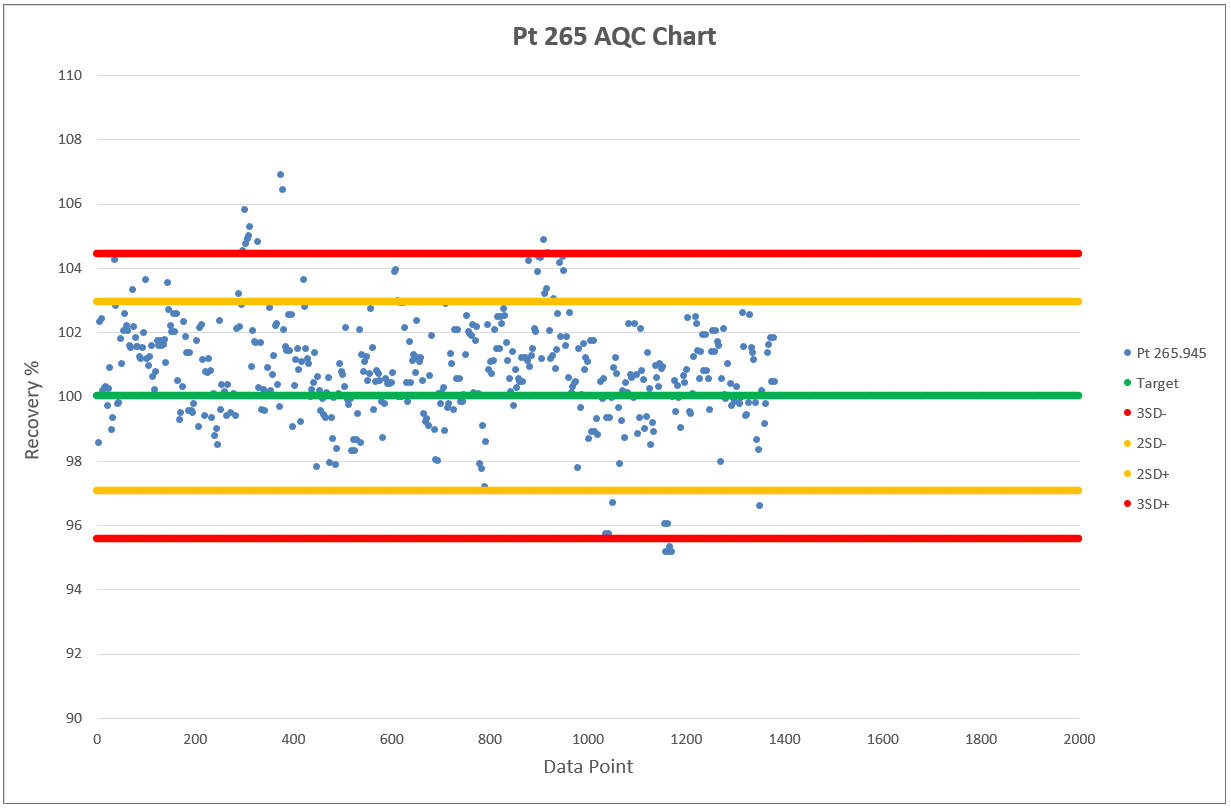
Chart 2, 3 and 4 shows the AQCs for gold, palladium and platinum as elements including in the analytical test method ATM 74. ATM 74 involves the determination of gold, palladium and platinum in metallic and powder material